

Portfolio View
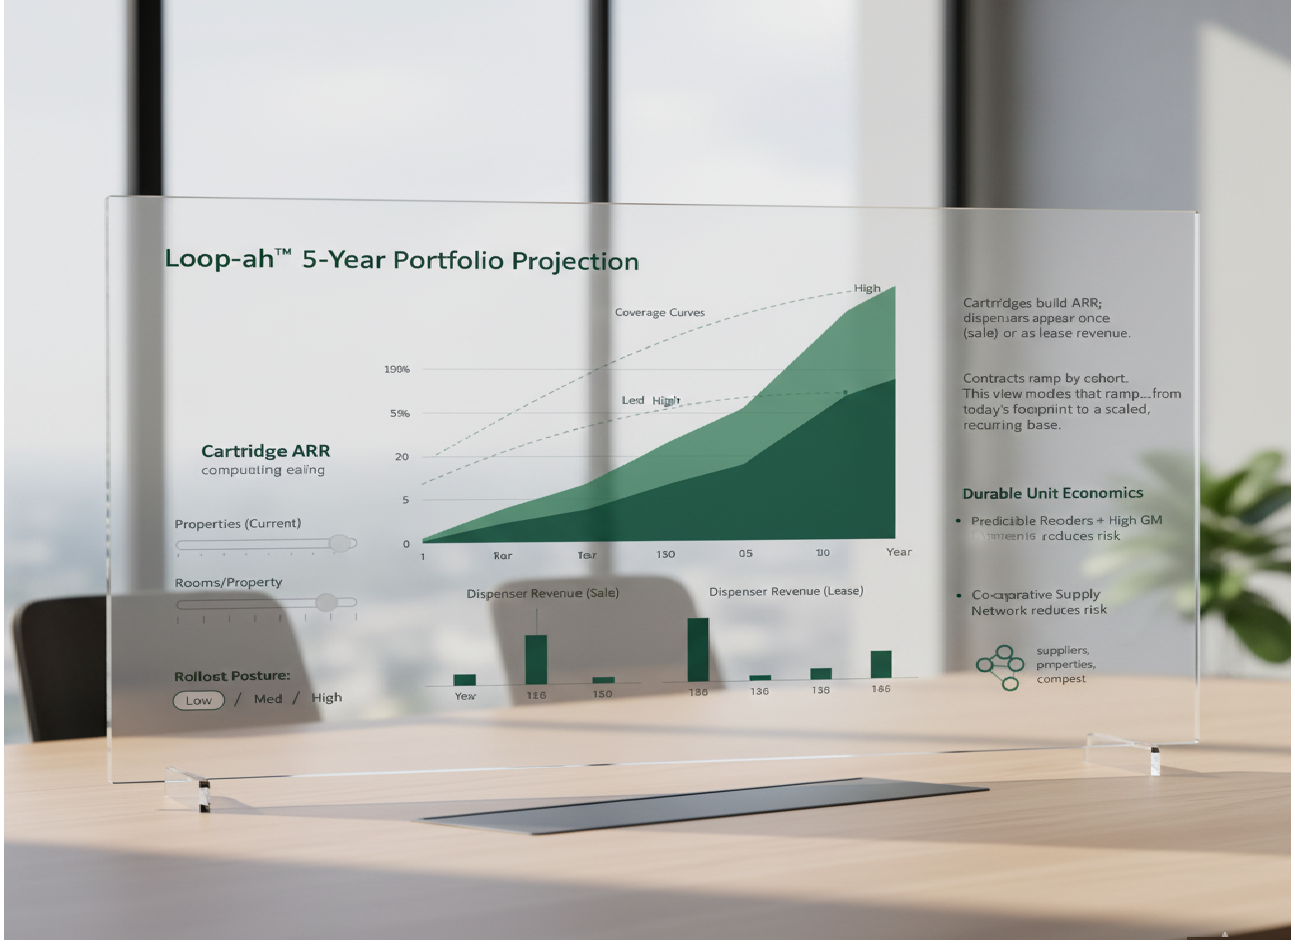
5-Year Portfolio Projection
Enter contracted rooms for each year. Revenue recognizes on delivery:
rooms × carts/room/yr × price. Usage does not affect recognition.
Cartridge ARR and GP drive the model; hardware is incidental.
Contracted rooms per year
Outputs (Y1→Y5)
Year 5 Total Cartridge ARR: —
Cumulative ARR: —
Headlines show the selected year; the table shows all years.
“Contracted rooms” = rooms contracted in that year. Cumulative ARR stacks each year as contracts build.
| Year | Contracted rooms | Total Cartridge ARR | Cumulative |
|---|
—
—