
Market Opportunity
Loop-ah targets a large, waste-heavy category with a circular hygiene system that cuts laundry load, labor, water, energy (kWh), chemicals, and towel-replacement costs—while elevating guest experience. Capture is contract-driven, converting rooms into predictable refill revenue.
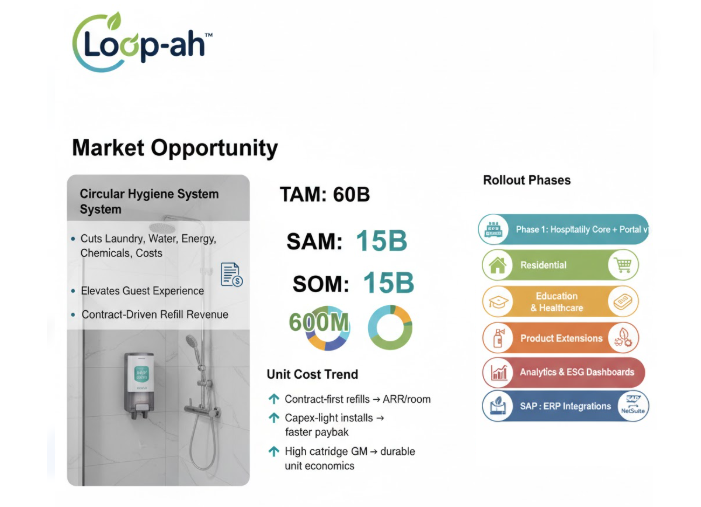
- Phase 1 — Hospitality Core + Portal v1: order & reporting portal; scale pilots and early contracts.
- Phase 2 — Residential: DTC & retail channel for recurring cartridges; subscription-ready.
- Phase 3 — Education & Healthcare: institutional footprint with compliance-friendly workflows.
- Phase 4 — Product Extensions: infused scents and embedded body-wash variants.
- Phase 5 — Analytics & ESG Dashboards: advanced impact reporting for enterprise buyers.
- Phase 6 — ERP Integrations: SAP/NetSuite hooks to automate POs, invoicing, and rollout.
Next: stress the numbers and model scenarios → Investors
The market potential is enormous — but so are the inefficiencies it hides. Hotels spend millions managing the very waste Loop-ah™ eliminates. Our opportunity isn’t just growth — it’s correction. By addressing what drains profit and ESG credibility today, we build a cleaner, more efficient tomorrow. → See how Loop-ah™ mitigates cost and waste
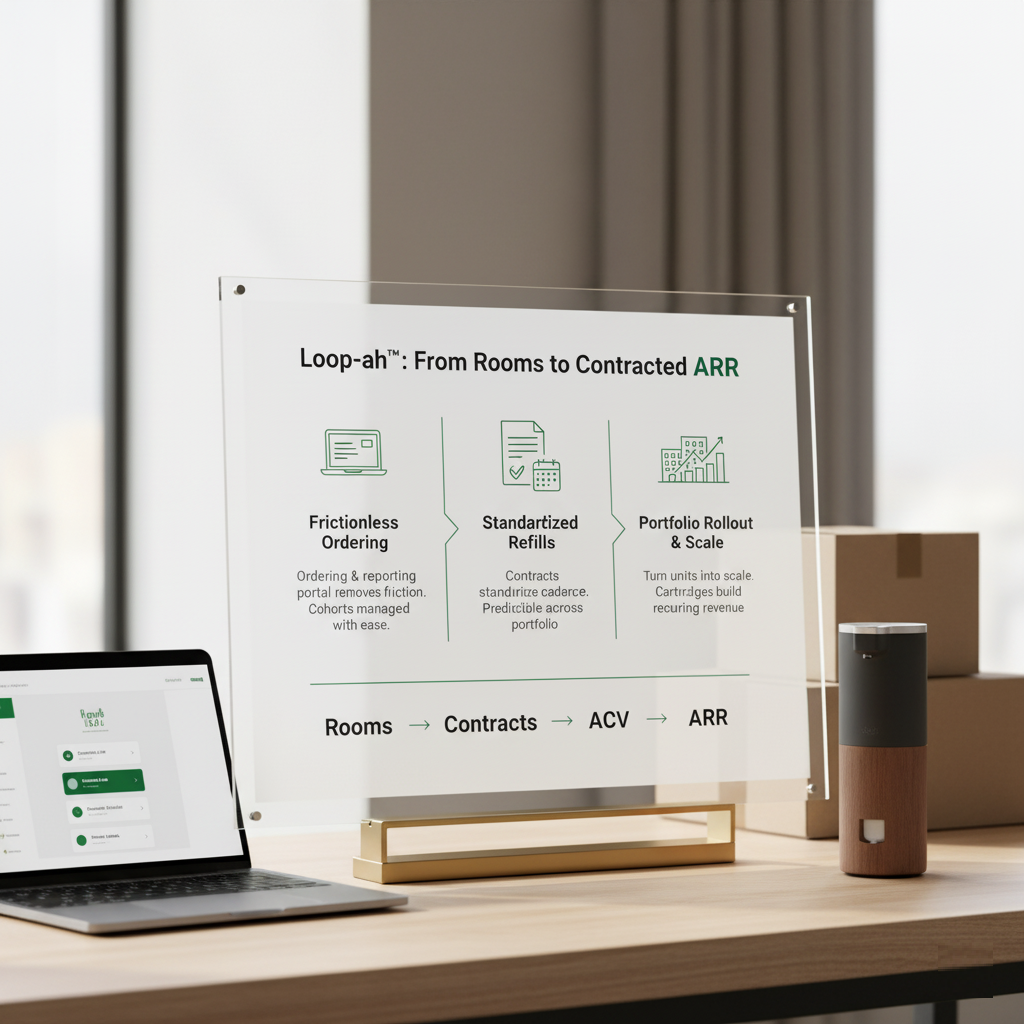
Why Loop-ah Works as an Investment
Contract-first revenue with high-GM refills turns rooms into predictable ARR. Capex-light installs and fast payback compound across a portfolio.
Marriott $1.2M Benchmark vs. Loop‑ah™
Industry reference vs. modeled value per room (opex + towel replacement avoided + Cartridge GP). Cards below show how many rooms are required to reach $1.2M annually under each approach.
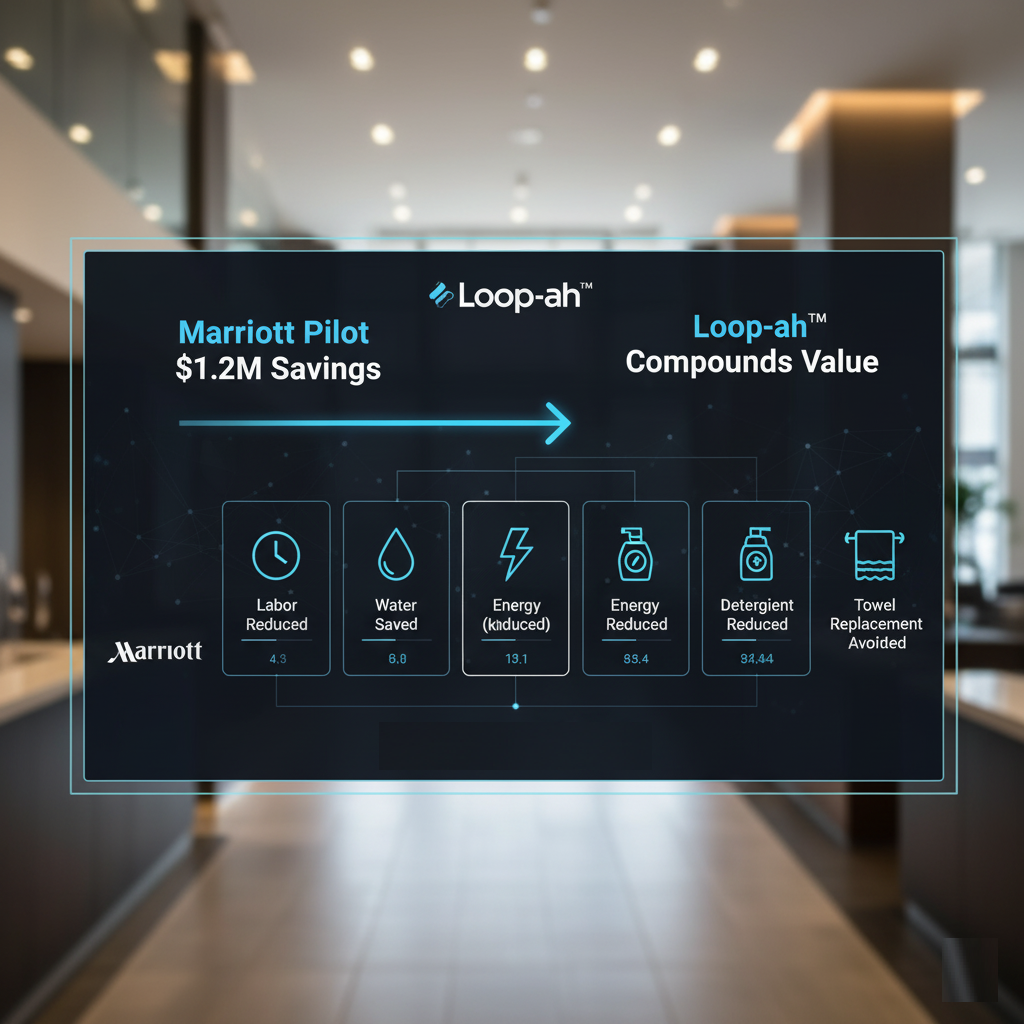
Why this matters
Next: see the 100-room operational breakdown ↓
Ops Savings Breakdown — Loop-ah™ (Annual, 100 Rooms)
Investor view: total includes Cartridge GP. Figures annual; water includes sewer.
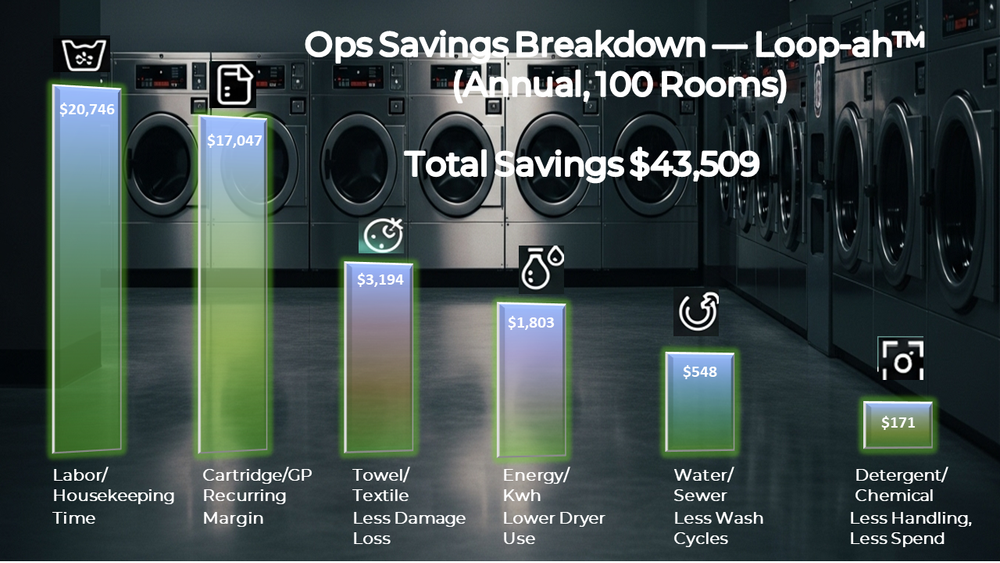
Annual Value (100 rooms)
| Component | Annual (100 rooms) | % of total |
|---|
Figures annual; water includes sewer; timeframes normalized as shown.
Industry vs Loop‑ah™ — Savings / Value (USD) — 500 Rooms

What you’ll see: each benchmark is normalized to 500 rooms and to the study’s timeframe; the Loop-ah column models the same timeframe.
| Industry KPI | Documented Result (normalized to 500) | Loop‑ah™ (500, same timeframe) | % Lift vs Industry | Why Loop-ah Wins Here |
|---|
Next: dig into Investor Metrics for contract cadence and ARR.